76% #fafaf9
14% #eb761d
7% #afb132
3% #d5957b
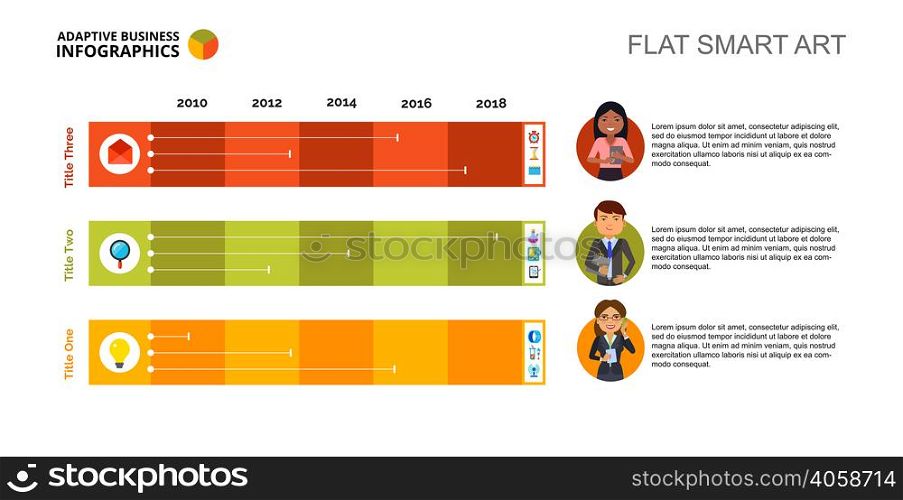
Three columns financial bar chart. Business data. Comparison, timeline, diagram. Creative concept for infographic, templates, presentation. Can be used for topics like management, recruitment, analytics.
Visually similar