CLUB
Photos
Vectors
Videos
NEW
More
Stockphotos
Club
Extended License
Compare licenses
Magic AI Edits
NEW
Pricing
Blog
Coupons
Business API
NEW
Image Tools
BG Remover
Upscaler
EPS Converter
Pricing
Blog
Help
Login
Join now
Stockphotos
Photos
Vectors
Videos
NEW
Pricing
Club
Blog
Coupons
Business API
NEW
Image Tools
Magic AI Edits
NEW
BG Remover
Upscaler
EPS Converter
All
Photo
Vector
Video
All
Photo
Vector
Video
Pricing
Join now
87%
#ecf1f2
9%
#20314b
5%
#409fc6
Edit with AI
Comp Image
Add to collection
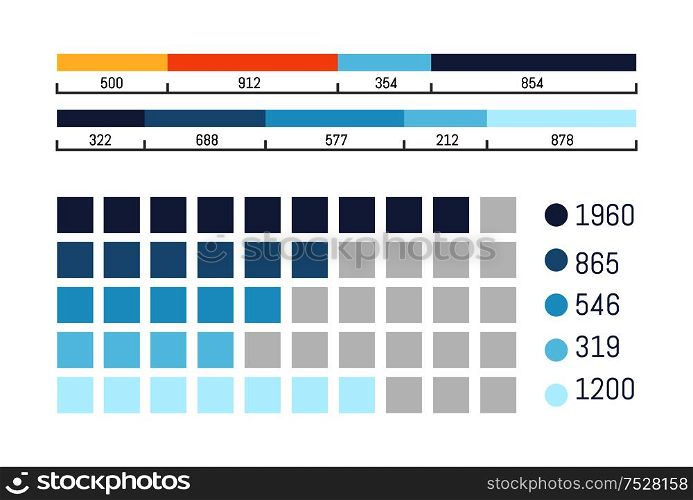
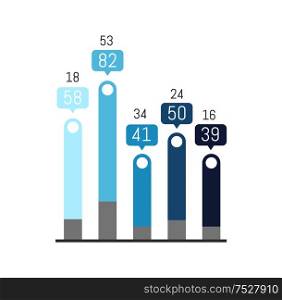
Infographic with scale and flowcharts information vector. Visual representation of analyzed data, results of research, statistics on scheme charts. Infographic with Scale and Flowcharts Information
Visually similar
More visually similar