94% #f1f0f2
3% #4f63a4
3% #de623c
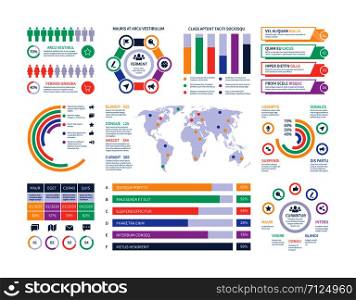
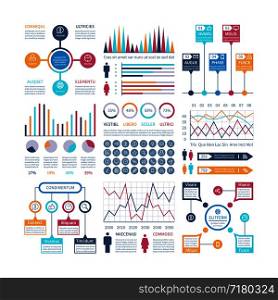
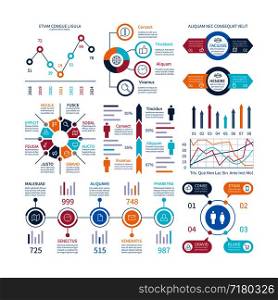
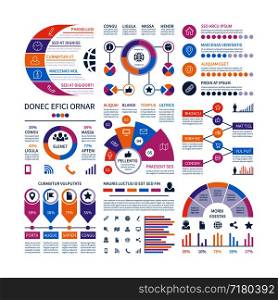
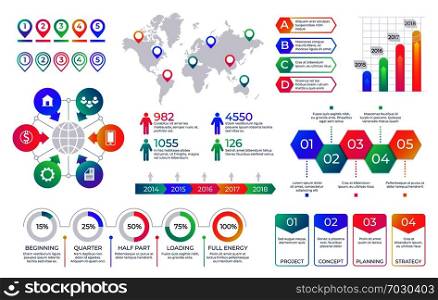
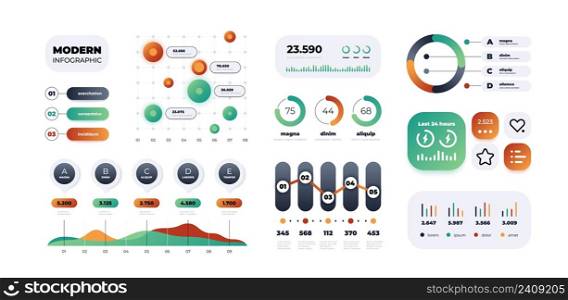
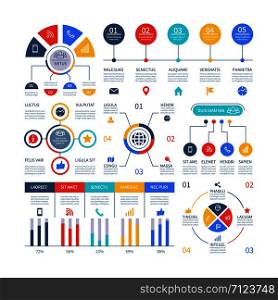
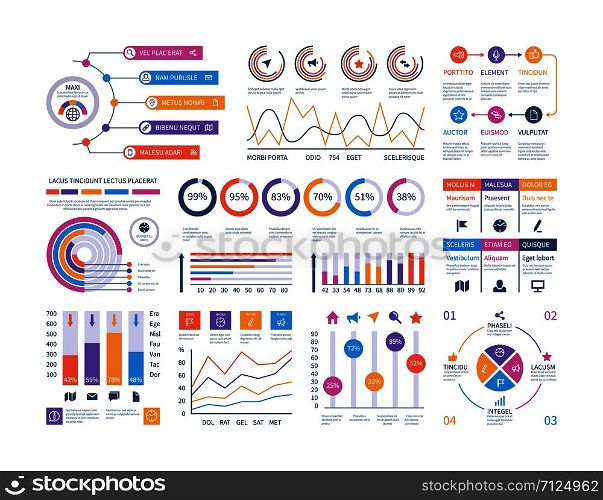
Infographic dashboard. Ui interface, information panel with finance graphs, pie chart and comparison diagrams. Vector budget report. Illustration of infographic business, graph and diagram planning. Infographic dashboard. Ui interface, information panel with finance graphs, pie chart and comparison diagrams. Vector budget report
Visually similar