68% #e7e8eb
29% #1c2023
3% #b0d288
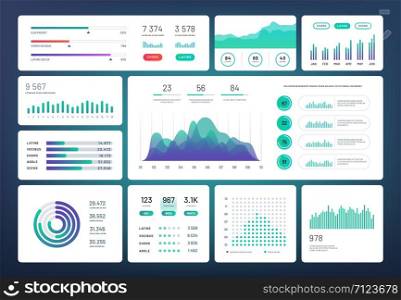
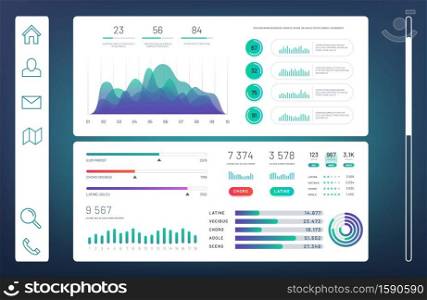
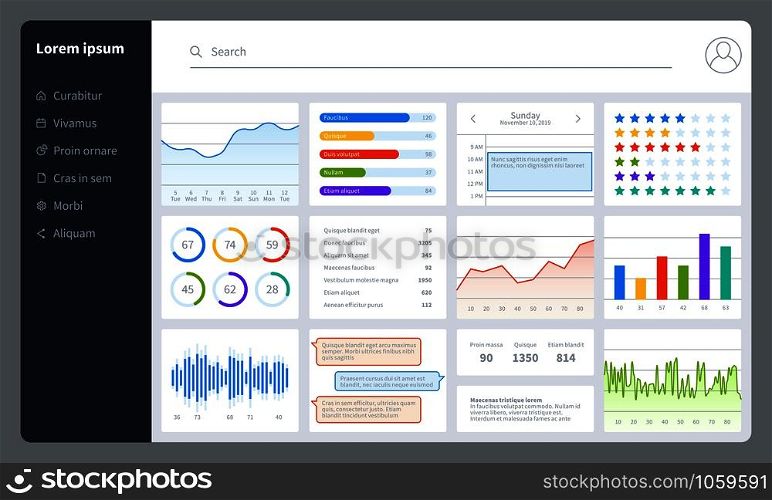
Dashboard. Progress bars, finance analytics data charts with ui. Report diagrams, graphs and interface for web application vector infographics simple statistics mockup. Dashboard. Progress bars, finance analytics data charts with ui. Report diagrams, graphs and interface for web application vector mockup
Visually similar