86% #f6f8f8
5% #519bd0
4% #d3d3af
3% #e2cf7f
2% #f8cf4c
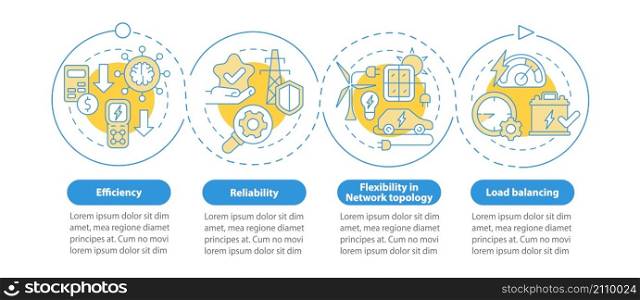
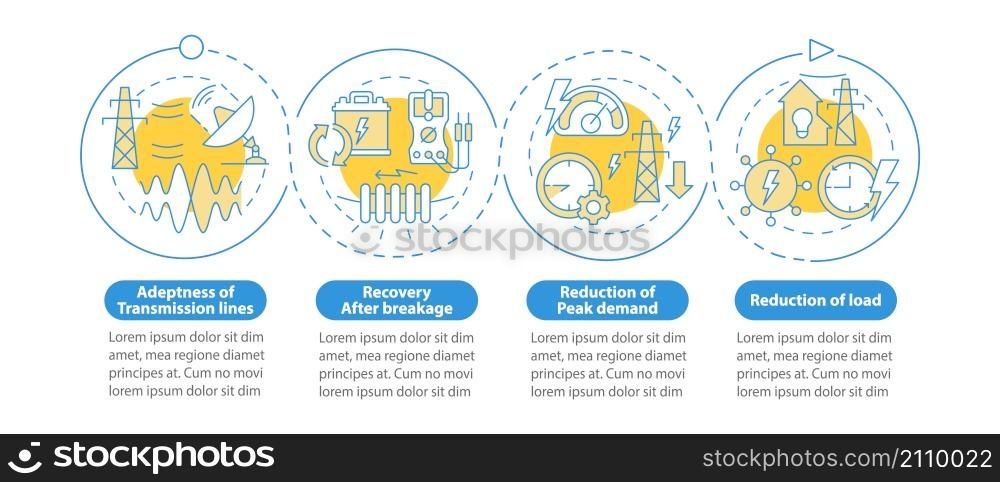
Applications of smart grid blue circle infographic template. Data visualization with 4 steps. Process timeline info chart. Workflow layout with line icons. Myriad Pro-Bold, Regular fonts used. Applications of smart grid blue circle infographic template
Visually similar