89% #f0f3f3
4% #f5bf6f
4% #5571a2
3% #f2a2a1
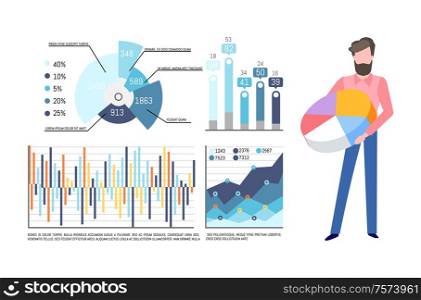
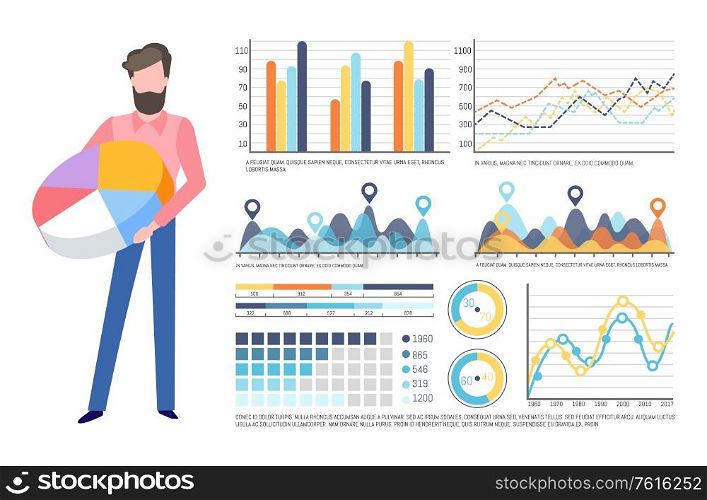
Analysis of data, visualized information vector. Schema and explanation, man with pie diagram and colored segments, graphics and infocharts info set. Businessman Holding Pie Diagram, Infocharts Set
Visually similar