87% #ecf1f2
9% #20314b
5% #409fc6
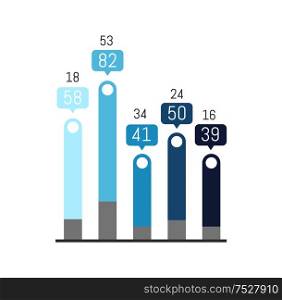
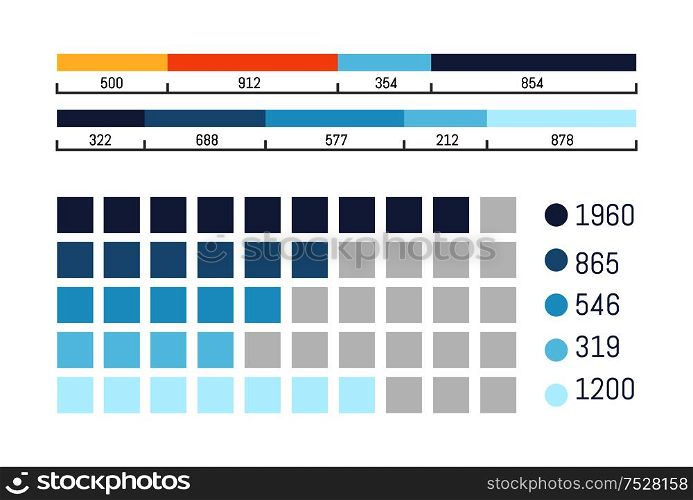
Infographic with scale and flowcharts information vector. Visual representation of analyzed data, results of research, statistics on scheme charts. Infographic with Scale and Flowcharts Information
Vergelijkbare beelden