62% #eae8f4
12% #2d2730
10% #9a99a9
8% #d8c4c5
5% #669fcd
4% #e15d18
Comp Image
Add to collection
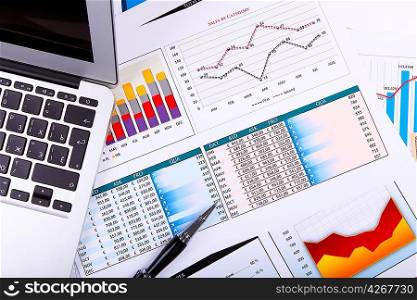
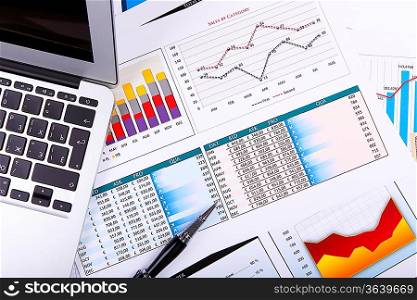
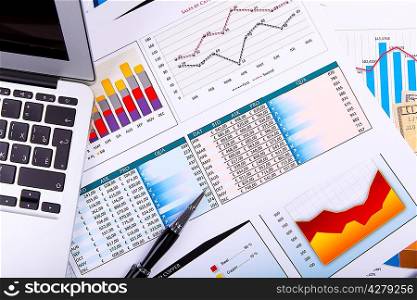
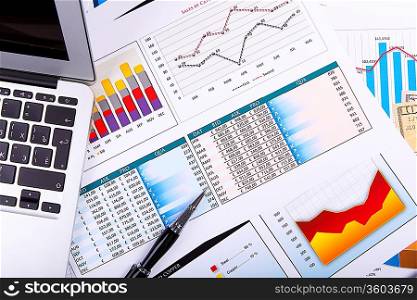
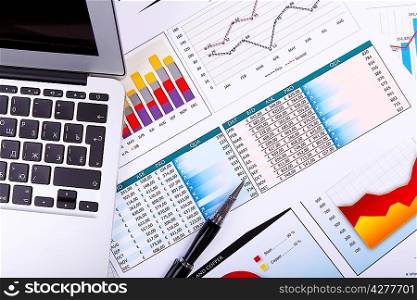
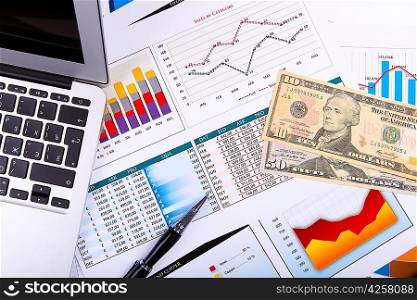
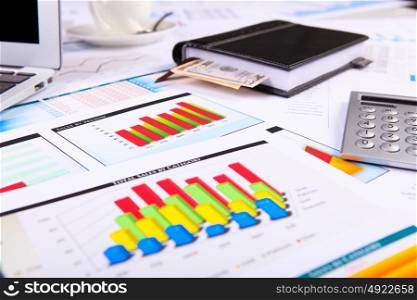
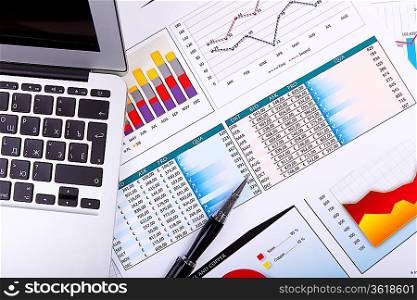
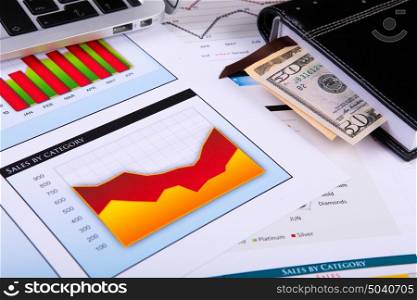
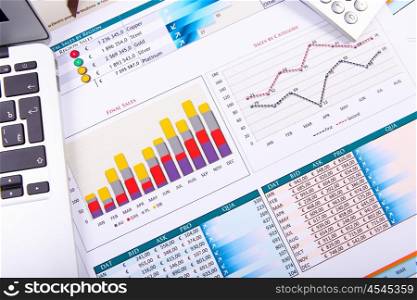
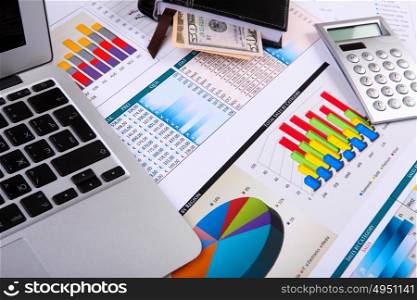
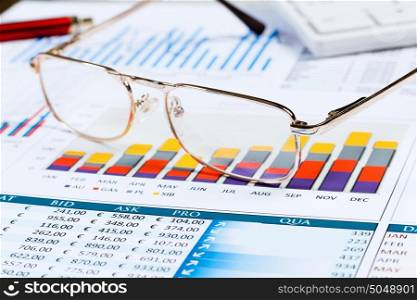
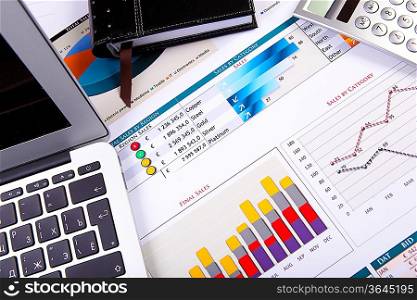
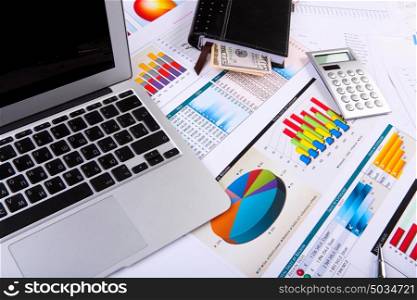
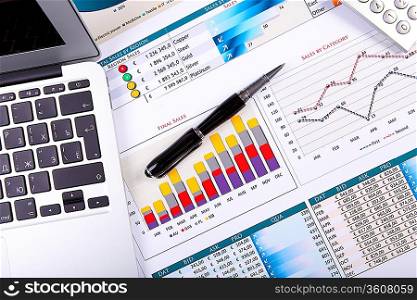
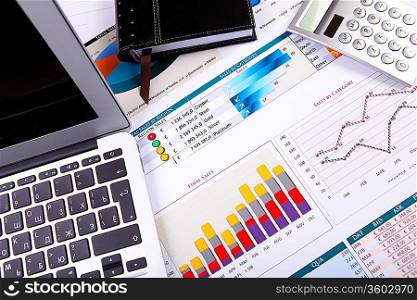
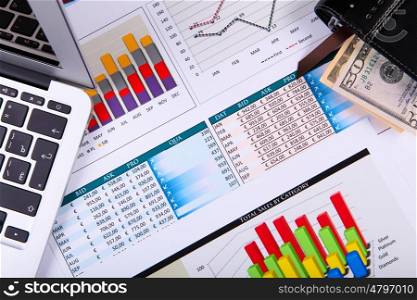
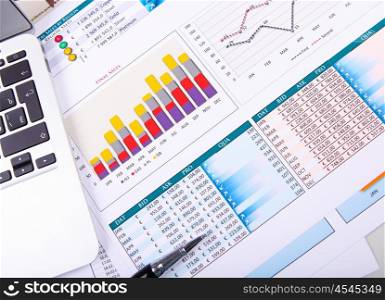
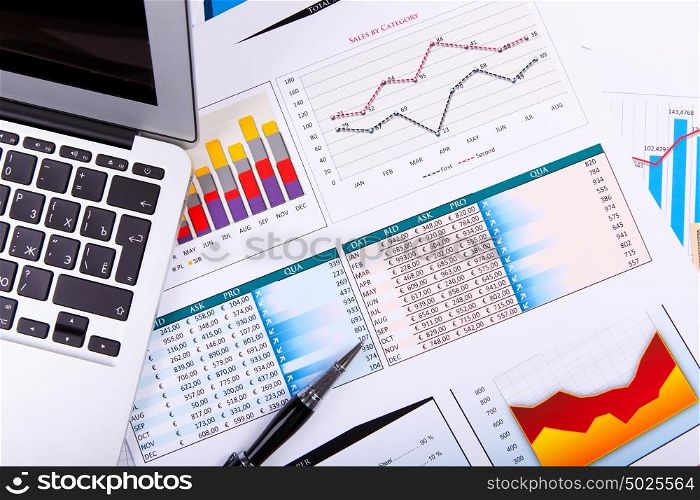
z5G4xvOeb7NVCaSp2x0tzKPYqWXH+hQWylYJnr1PHqSp9AhgX1B72QE9ghdJbc1JVvlKJLNPOSqVdLFpbaHTCGv3jJIXzXtmK0gxMJ7s5rKGMKiIqJV/CFxtuvE3azIwvCTi6a+jGg+2zod1fL7pig8xJlqPrbC+MSbSsx8OoR3/duQhiraJYjZAfMuKZWVez50G1YUcWcSmuIs8Lp3BXmjaucyder/+. Financial paper charts and graphs on the table
Visually similar