CLUB
Fotos
Vektoren
Videos
NEU
Mehr
Stockfotos
Club
Erweiterte Lizenz
Lizenzen vergleichen
Magic KI-Edits
NEU
Preise
Blog
Gutscheine
Business-API
NEU
Bild-Tools
BG Remover
Upscaler
EPS Converter
Preise
Blog
Hilfe
Anmeldung
Club beitreten
Stockfotos
Fotos
Vektoren
Videos
NEU
Preise
Club
Blog
Gutscheine
Business-API
NEU
Bild-Tools
Magic KI-Edits
NEU
BG Remover
Upscaler
EPS Converter
Alle
Foto
Vektor
Video
Alle
Foto
Vektor
Video
Preise
Club beitreten
76%
#f0f2f2
8%
#9cd7e6
6%
#4ba9d0
5%
#69757f
5%
#192d4a
Mit KI bearbeiten
Comp Bild
Zur Sammlung hinzufügen
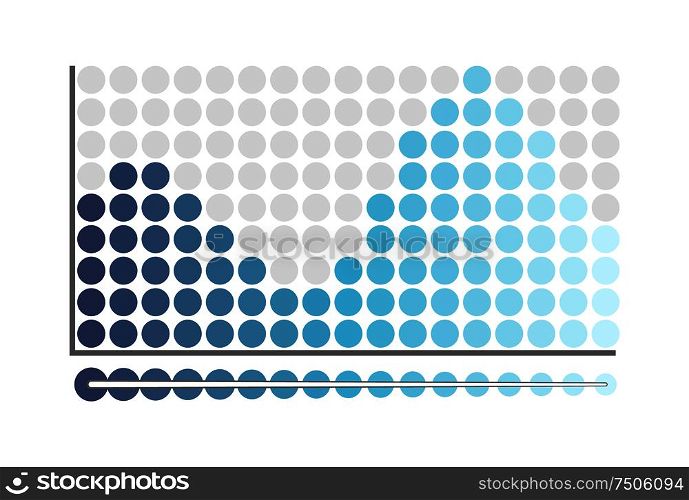
Graphic chart, representation of information report vector. Timeline with growing and falling down circles. Infographic flowchart with business data. Graphic Chart Representation of Information Report
Visuell ähnlich
Visuell ähnlicher